

Examples are illustrative unless otherwise attributed.
Start with the outcome the campaign is meant to create
A paid-media report can look healthy while the business becomes harder to operate. Inquiries increase, but sales spends longer rejecting poor fits. Purchases arrive, but returns rise. Trials grow, but users never reach a useful result. Learning to read these patterns is a central digital marketing skill.
Define two outcomes before reviewing an account: the customer’s useful result and the business result that makes delivering it sustainable. For a software product, the first might be completing a first successful workflow. The second might be acquiring customers who remain active and contribute enough margin to cover acquisition and support.
Practice: write one sentence for each outcome. Then identify the observable event that would support it. “More traffic” is a distribution measure; it does not describe what improved for the customer.
Follow the chain from query to retained customer
Trace search intent, ad promise, destination, inquiry or purchase, first value, and repeat use. Put one measure beside each step. Query relevance helps explain who arrived. Landing-page conversion describes action. Qualification indicates fit. Activation and retention reveal what happened after the first commitment.
Use consistent definitions and observation periods. Do not compare a mature cohort with one that has had only two days to convert. Preserve unknowns when identity, consent, or reporting gaps prevent reliable connections.
For keyword research, ask which customer situation a query represents and whether the destination serves it. A high-volume phrase can be strategically weak if it attracts a different use case. A smaller cluster may be more useful when the business can satisfy its intent.
A cheaper lead is useful only when the rest of the journey makes sense.
Work through a fictional lead-quality comparison
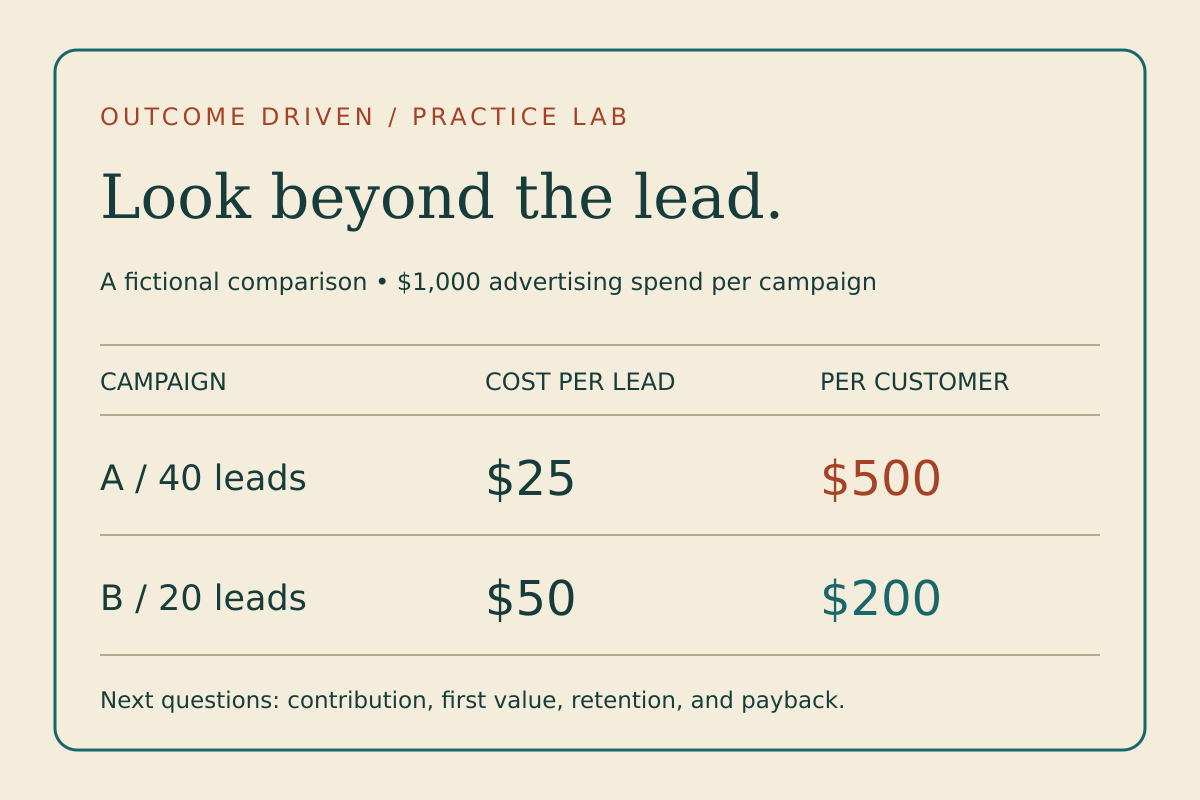
Imagine two campaigns, each spending $1,000 during comparable acquisition periods. After allowing the same time for leads to mature, campaign A produces 40 leads, eight qualified opportunities, and two new customers. Campaign B produces 20 leads, ten qualified opportunities, and five new customers. This is a teaching dataset, not a measured case study.
- Campaign A: $25 per lead, $125 per qualified opportunity, $500 media cost per customer.
- Campaign B: $50 per lead, $100 per qualified opportunity, $200 media cost per customer.
Choosing A because of its cheaper leads misses the downstream difference. B has better acquisition economics in this example. That still does not prove B is more profitable: customer contribution, refunds, retention, sales effort, and delivery costs could differ.
Practice: calculate the lead-to-customer rates: 5% for A and 25% for B. Write three possible explanations for the gap, then state the evidence you would need to distinguish them. Consider audience fit, message expectations, follow-up, and sales capacity.
Calculate an acquisition ceiling from contribution
Suppose a first purchase brings in $200 and leaves $80 after variable product, fulfillment, payment, and expected return costs. The contribution margin before acquisition is 40%. On that basis alone, media-only break-even ROAS is 1 ÷ 0.40 = 2.5×.
A 2.5× ROAS would consume the entire $80 contribution in advertising. It leaves nothing for overhead or profit. If another $15 per customer is allocated to acquisition work, only $65 remains for media before those other needs. An operating target must leave an appropriate cushion.
For recurring products, be explicit about the observation period and uncertainty in future contribution. Projected lifetime value can make an expensive campaign appear affordable long before the cash arrives. Use observed retention and a realistic payback constraint when the evidence permits.
Distinguish attributed revenue from additional revenue
Attribution assigns credit to marketing touchpoints under a chosen reporting model. Incrementality asks how much more happened because of the activity. A customer who already intended to buy may click a brand ad, and several platforms may claim influence on the same transaction.
Reconcile reports to actual orders or customer records and avoid adding platform-attributed revenue together as if every claim were unique. When scale and operational conditions support it, a carefully designed holdout or geographic experiment can help investigate causal contribution. Small or poorly matched groups can still produce inconclusive answers.
Practice: mark each claim in a sample report as observed, attributed, estimated, or causal. Rewrite any sentence that claims more than the underlying design supports.
Use diagnosis to choose the next experiment
If visitors arrive on relevant searches but leave before understanding the offer, inspect promise-to-page alignment. If forms convert but sales rejects most leads, inspect qualification and targeting. If customers buy and fail to activate, investigate onboarding and the product experience before expanding acquisition.
Write a hypothesis that names a mechanism: “Explaining the implementation requirements before the form will reduce unsuitable inquiries while preserving qualified opportunities.” Define the primary outcome and a guardrail; a lower form conversion rate could be acceptable if customer acquisition improves.
Decide the review period using traffic, expected effect, conversion delays, and the buying cycle. Record concurrent changes. Do not call an A/B test successful because one variant briefly leads, and do not require a statistically conclusive test to fix an objectively broken form.
Build a weekly practice around one decision
Spend the first review on data quality, the second on a journey bottleneck, and the third on an intervention you can evaluate. Each cycle should produce a one-page decision note: question, evidence, interpretation, alternative explanation, action, guardrail, and review date.
AI can check calculations and surface questions from anonymized reports. Ask it to quote the supplied evidence and label speculation. It cannot infer causal lift simply by rewriting a dashboard summary.
Use the Outcome Experiment Canvas to specify the test, the PPC planner to explore assumptions, and the Growth Check to locate the part of the journey that deserves attention. The learning goal is a better decision about the customer journey, with an honest account of the evidence.
Questions to ask before increasing spend
- What valuable customer action are we buying, and how was it verified?
- How many new customers remain after duplicates, cancellations, and refunds?
- What costs and time period are included in our acquisition calculation?
- Did the customers reach the promised first useful result?
- What evidence supports the next budget increase, and what would make us reverse it?
Document the answers with a teammate. If one is unknown, turn it into the next research or measurement task rather than smoothing it over with a confident forecast.
Sources & further reading
Google Skillshop: Search and Measurement training ↗Google Analytics Academy ↗Google Ads: primary and secondary conversion actions ↗Background references are distinguished from our original examples and proposed exercises.