


Examples are illustrative unless otherwise attributed.
Translate the business decision into a report question
“Traffic is up” is an observation without a decision. An acquisition review should ask whether additional visitors became customers who reached value at an acceptable cost. An onboarding review should ask where eligible people stopped. Start with the decision owner and the action under consideration, then choose the report that contains relevant evidence.
Record the reporting window, timezone, source systems, event definition, and exclusions. Include when data was extracted. A recurring report with changing definitions can look like a trend even when the underlying behaviour is stable.
Check scope before interpretation
First-user acquisition describes a person’s original recorded acquisition source. Session acquisition describes visits. The same person can appear in different session groups across time. Event counts, sessions containing events, and deduplicated customers are also distinct. A key-event label means your team marked an event important; it does not certify business value.
Agree which record owns which fact: the ad platform for spend, analytics for observable journeys, CRM for lead qualification, and the order or billing system for completed purchases. Preserve differences instead of averaging incompatible counts into a convenient answer.
Better evidence makes the next decision more useful.
Find the bottleneck in a segmented example
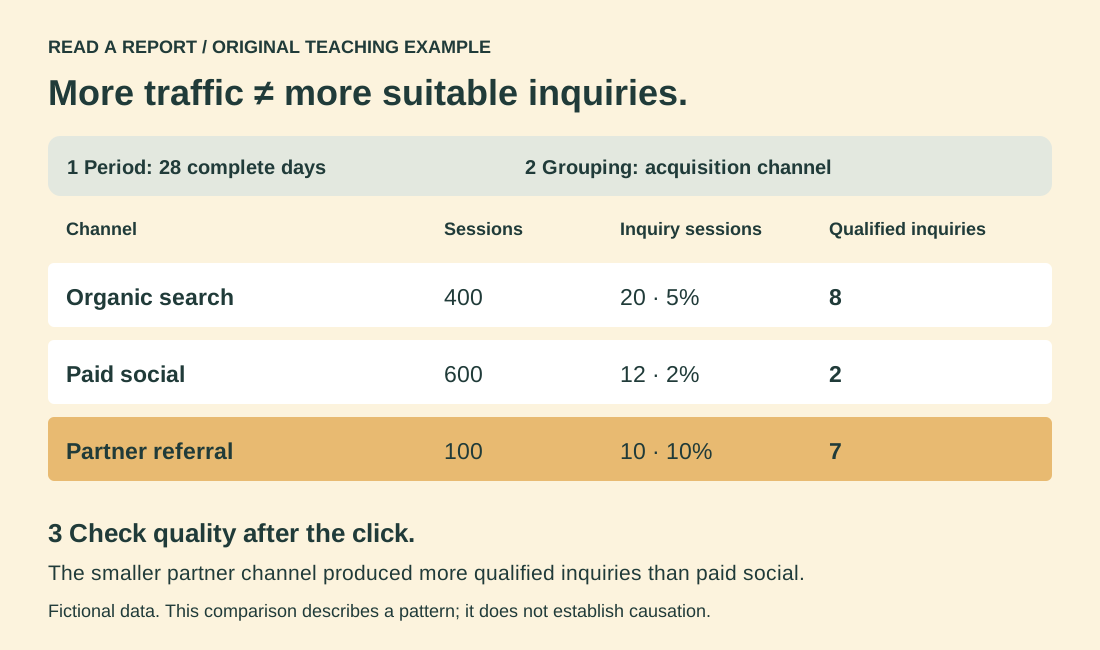
| Channel — fictional 28 days | Sessions | Sessions with inquiry | Inquiry session rate | Qualified inquiries |
|---|---|---|---|---|
| Organic search | 400 | 20 | 5% | 8 |
| Paid social | 600 | 12 | 2% | 2 |
| Partner referral | 100 | 10 | 10% | 7 |
| Total | 1,100 | 42 | 3.82% | 17 |
The total inquiry-session rate is 42 ÷ 1,100 = 3.82%, not the unweighted average of 5%, 2%, and 10%. Qualification then changes the picture again: 17 inquiries meet the defined fit criteria. Organic and partner cohorts appear promising, but channel, audience, destination, and timing may differ.
The next analysis should examine whether the same offer and qualification rules were used. Compare downstream activation and closed deals before shifting spend. An expensive source can still be worthwhile if customers require less support and retain longer; a cheap source can conceal delivery costs.
Use search reporting to diagnose a different part of the journey
Search Console helps inspect exposure and click behaviour before arrival. Filter by query, page, country, and device before interpreting aggregate CTR or position. Separate brand demand from discovery queries when the data allows. A new broad query mix can reduce average CTR while bringing more valuable prospects.
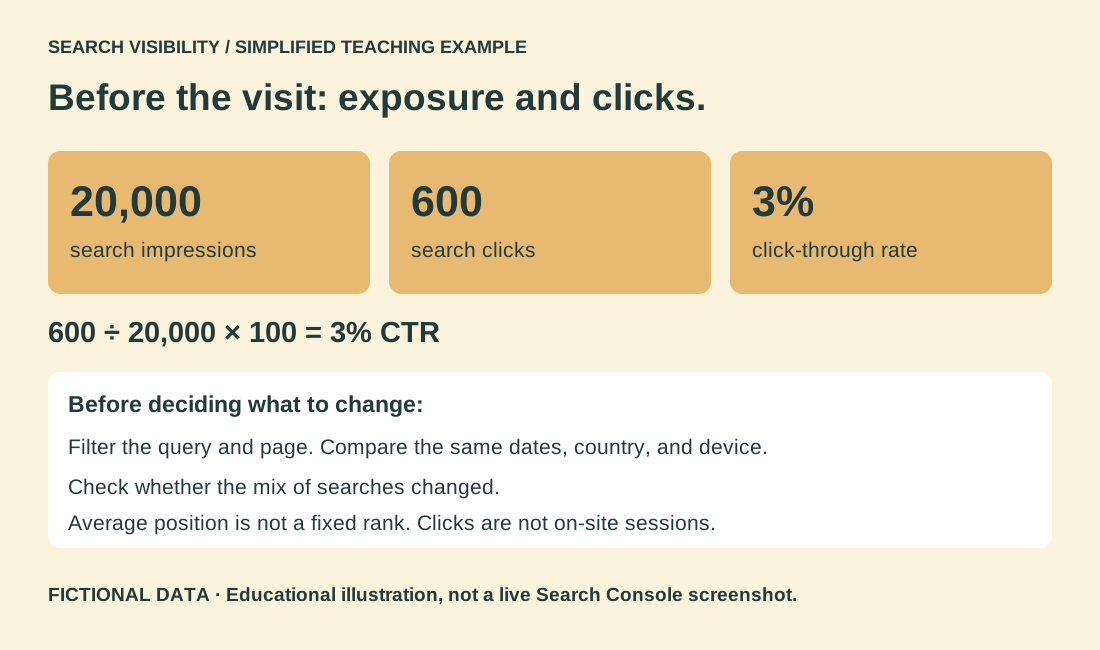
Treat the click-to-arrival gap as a measurement question. Search clicks and analytics sessions have different definitions and collection constraints. Search visibility is not a direct measurement of customer satisfaction or revenue.
Look for composition changes and instrumentation faults
Suppose mobile now makes up a larger share of traffic and has a lower completion rate. Total conversion can fall even if neither mobile nor desktop worsened. Review segment sizes as well as segment rates. Similarly, marking an overly broad event as a key event can change engagement metrics without any improvement in customer experience.
Inspect recent releases, tag changes, redirects, consent changes, and sales-process changes. Compare a known completed transaction with its expected event record. Maintain a short data-quality log. When the denominator is unreliable, an exact-looking percentage is not actionable precision.
Write a decision memo instead of a chart commentary
A useful memo contains the observation, the uncertainty, the proposed action, the guardrail, and the review date. For example: “Seven partner inquiries met our criteria. We will test one similar partner with a bounded invitation, keeping the offer constant. We will review first-value completion and sales effort before expanding.”
This is a proposed experiment, not a claim that partner traffic caused superior results. Report small samples as counts alongside rates and wait for the relevant follow-up window. If the evidence cannot distinguish competing explanations, choose a small diagnostic action that can.
Continue the traffic and growth learning path
Sources & further reading
Google Analytics: Traffic acquisition report ↗Google Analytics: User acquisition versus Traffic acquisition ↗Google Search Console: Performance report ↗Google Analytics: Engagement rate and bounce rate ↗Background references are distinguished from our original examples and proposed exercises.