
Practical AI workflows
Measure the customer outcome behind Claude’s new office workflow
A better board and a faster report matter when they improve the decision and the customer’s next step.

In this guide
How can these tools help with a practical task?
Did an onboarding change help more people reach a defined first useful result?
The most interesting part of Claude’s office expansion is the possibility of keeping analysis and action close together. That still leaves an essential product question: what customer progress should this workflow support? A team can make more artifacts without reducing confusion, delay or failure. Start with the outcome and work backward to the evidence.
What Anthropic announced
On November 10, 2026, Anthropic introduced Claude Sheets and Whiteboards in beta and made Claude Data, formerly Dashboards, generally available on paid plans. Sheets supports editable formulas and Excel/CSV export; Whiteboards supports shared visual planning. Data works with connected data sources and adds visual stories, including narrated videos. Certified queries and live sharing remain beta features.
Interactive connectors are also expanding to full app views where supported, including Adobe and Atlassian. Availability depends on rollout and organizational settings. Claude Meetings is described as coming soon in the overview; the Whiteboards help page documents Google Meet beta support on Team and Enterprise. Check your account before planning around it; Zoom and Microsoft Teams are not supported in that documented beta.
Before you start
Open Claude and confirm that your paid account has the Sheets and Whiteboards templates in Artifacts. Team plans enable them by default; an Enterprise owner must enable them. If a template is missing, check your plan and organization settings before following this exercise. No live meeting or connected business account is required for the sample below.
Start a chat, paste the labeled sample data and ask for a Sheet. In a separate request, ask for a Whiteboard using the reviewed findings. Copy the relevant context explicitly: the Whiteboards help page says connected-app context is not currently available to the board. These are suggested prompts, not a transcript of a hands-on test in Claude.
Your four-step workflow
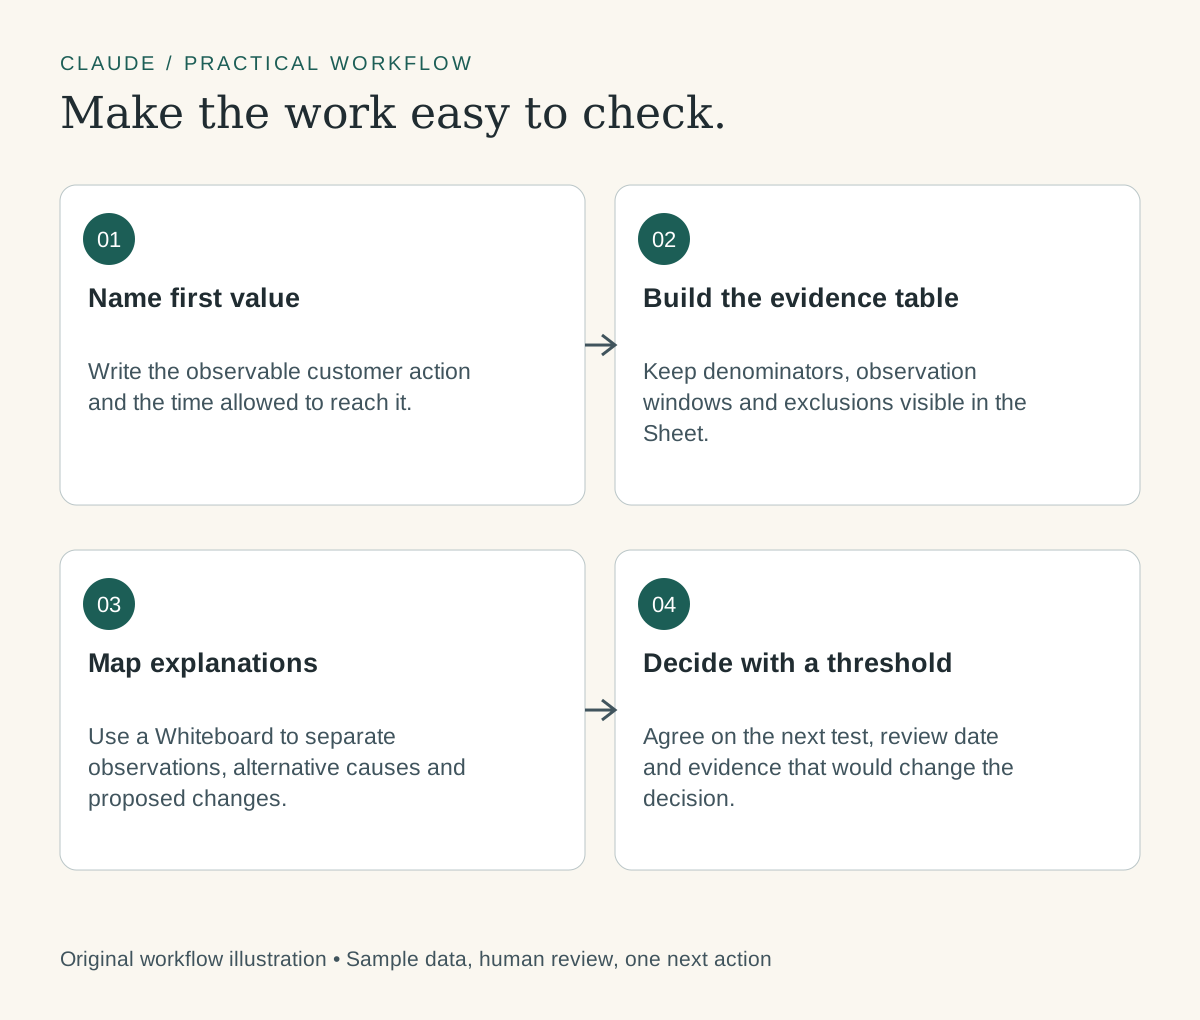
- Name first value. Write the observable customer action and the time allowed to reach it.
- Build the evidence table. Keep denominators, observation windows and exclusions visible in the Sheet.
- Map explanations. Use a Whiteboard to separate observations, alternative causes and proposed changes.
- Decide with a threshold. Agree on the next test, review date and evidence that would change the decision.
Worked example: Did an onboarding change help more people reach a defined first useful result?
Fictional practice example. These inputs and expected outputs demonstrate the method. They are not client results, portfolio metrics or evidence that this task was run in Claude.
| Cohort | Eligible accounts | Reached first value |
|---|---|---|
| Before | 100 | 28 |
| After | 120 | 42 |
Paste this prompt into Claude
Create a Claude Sheet using only the following SYNTHETIC PRACTICE DATA. Do not connect accounts or invent missing values. Keep raw inputs separate from calculations. Include visible formulas and an Assumptions tab. The decision is: Did an onboarding change help more people reach a defined first useful result?

Cohort,Eligible accounts,Reached first value
Before,100,28
After,120,42

Use these formulas, with the header in row 1:
D2 = IF(B2=0,"",C2/B2)  → first-value rate
D3 = IF(B3=0,"",C3/B3)
D4 = D3-D2  → change in percentage points when displayed as a percentage

Explain the calculation and flag missing inputs. Keep zero denominators blank and identify why the result is unavailable. Do not claim these are real business results.
Check the expected result
The fictional rates are 28% and 35%, a difference of 7 percentage points. The relative increase is 25%, calculated as (35%-28%)/28%.
A before/after difference does not establish causation. The cohorts might have different acquisition sources, plans or observation windows. Define “first value” as a specific completed customer task, then check comparable eligibility and timing. Put competing explanations on the board before recommending a wider rollout.
Turn the reviewed result into a board
Create a Whiteboard for this reviewed sample. Make four sections: Evidence, Assumptions, Open questions, and Next action. Evidence: The fictional rates are 28% and 35%, a difference of 7 percentage points. The relative increase is 25%, calculated as (35%-28%)/28%. Interpretation to review: A before/after difference does not establish causation. The cohorts might have different acquisition sources, plans or observation windows. Define “first value” as a specific completed customer task, then check comparable eligibility and timing. Put competing explanations on the board before recommending a wider rollout. Add one owner and review-date placeholder; do not invent names or commitments. Keep the sample labeled fictional. Do not send messages or change connected apps.
Make the handoff useful
If a connected Data view is available, agree on the metric definition and inspect its underlying query before distributing the story. A narrated explanation can make a finding easier to understand, but it cannot repair a weak comparison. Include the missing evidence in the narration rather than smoothing it away.
Before sharing, check one ordinary row, one missing value and one zero-denominator case. Confirm that totals use the intended rows. Open the exported Excel file and inspect formulas and formatting; a CSV export does not preserve a workbook’s tabs and presentation. Share only the reviewed version with the intended people.
If you later use Claude Data, inspect the data source, metric definition and refresh time. Ask for the uncertainty to appear in any data story. If Meetings is available to your team, follow your organization’s participant-notice and recording practices; otherwise use notes you are permitted to share. The worksheet exercise works without a meeting assistant.
Try it on one real task
Replace the sample with data you are authorized to use, keep the same review question and record what needed correction. A useful first result is a checked artifact and a decision someone can act on.
Official sources
Feature information checked November 11, 2026. Examples, prompts and interpretation are original editorial guidance.
Sources and further reading
- Anthropic: Sheets, Whiteboards and Data — November 10, 2026
- Claude Help: getting started with Sheets
- Claude Help: Whiteboards, including Meetings availability and limitations
- Anthropic: interactive connectors and full apps
- Anthropic: the wider workplace announcement
Sources checked November 11, 2026. Review the linked publisher information for current details.
Put one idea to work
Define the customer outcome, smallest useful deliverable, evidence, and review decision before expanding the work.
Plan an expertise pilot →Explore more from Outcome DrivenExplore the Outcome Club signup →Keep practicing
 Agent-friendly websites
Agent-Ready Website Testing: Measure Task Success
Build an evaluation plan for agent-friendly websites with task outcomes, guardrails, failure analysis and an honest before-and-after experiment.
November 11, 2026 · 8 min read AI browser workflows
From open tabs to a decision you can defend
Use ChatGPT to turn scattered browser research into an evidence table, an explicit uncertainty, and one next action. A five-step guide with an illustrative pilot decision.
November 11, 2026 · 8 min read